Cleaning Robot ROI Math That Survives the CFO
The exact cost model finance teams want to see — labour displaced, all-in robot cost, and an honest payback period — with a worked example.
By WhichBot Team
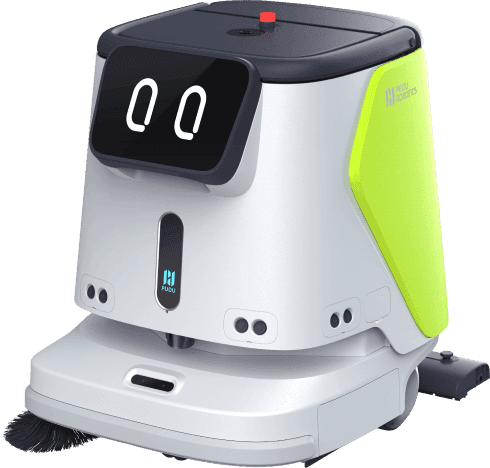
Operations loves the robot. Finance kills the deal. The gap is almost always a cost model that ignores the boring line items. Here is the model we use, and the one our Fleet & ROI Planner implements.
The two columns
You are comparing two ways to clean the same square metres at the same frequency.
Manual cleaning (the status quo)
manual_hours/yr = (area / manual_throughput) × passes/yr
manual_cost/yr  = manual_hours/yr × fully_loaded_labour_rate
Use a fully loaded labour rate — wages plus benefits, payroll tax, turnover, and supervision. In many markets that's 1.3–1.5× the base wage.
Robot cleaning (the proposal)
robot_hours/yr  = (area / real_throughput) × passes/yr
opex/yr         = robot_hours × energy_cost + annual_maintenance
capital/yr      = purchase_price / lifespan_years
supervision/yr  = supervision_hours × labour_rate
robot_total/yr  = opex + capital + supervision
The number finance actually asks for
Payback period is the question behind every other question:
payback_months = purchase_price / (manual_cost − robot_opex − supervision) × 12
Note what's not in the denominator: capital. Payback measures how fast the operating savings repay the up-front machine. A healthy deal in a large hard-floor facility lands at 14–28 months. Above ~40 months, the deal is fragile to any change in labour rates or utilization.
A worked example
Worked example. The figures below are an illustrative 8,000 m² retail floor cleaned six nights a week — representative numbers to show the shape of the math, not a specific customer.
Put real numbers in the two columns and the deal either holds or it doesn't:
| Line item | Manual | Robot |
|---|---|---|
| Cleaning labour / yr | $58,000 | $12,000 (supervision) |
| Energy + maintenance / yr | — | $6,000 |
| Consumables / yr | $2,000 | $2,000 |
| All-in operating / yr | $60,000 | $20,000 |
| Machine (one-off) | — | $32,000 |
The operating gap — $40,000/yr — is what repays the machine.
The robot's all-in operating cost (supervision + energy + maintenance + consumables) still beats manual by $40k/yr. That gap — not the sticker price — is the deal.
At a $32,000 machine and ~$3,300/month in net operating savings, the up-front cost repays in about 10 months — faster than the 14–28-month band typical of larger hard-floor sites, because this is a cheaper machine against a big labour gap. Smaller, single-machine deals often beat the range; big multi-unit fleets sit inside it:
Break-even at ~9.7 months on a $32,000 upfront outlay saving $3,300/month.
Three honesty checks
- Real throughput, not spec-sheet. Discount rated coverage by 25–40% — and harder (around 55%) for bold "up to" theoretical-max figures.
- Don't zero out humans. Robots shift labour, they rarely eliminate it. Budget supervision.
- Match lifespan to reality. Five years is typical; aggressive duty cycles shorten it.
Plug your own numbers into the Fleet & ROI Planner — it shows every line item so you can hand the breakdown straight to finance.
Put these numbers to work
See which robot fits your facility and what it would save you.
Run the Fleet & ROI Planner