The Fleet-Dashboard Metric Worth A$1,392 a Month Per Cleaning Robot
Coverage percentage is a vanity metric. Interventions per robot-hour is the number your ROI is actually computed from — worked through a PUDU MT1 across six distribution depots, plus what to demand from a vendor's fleet software before you sign.
By WhichBot Team
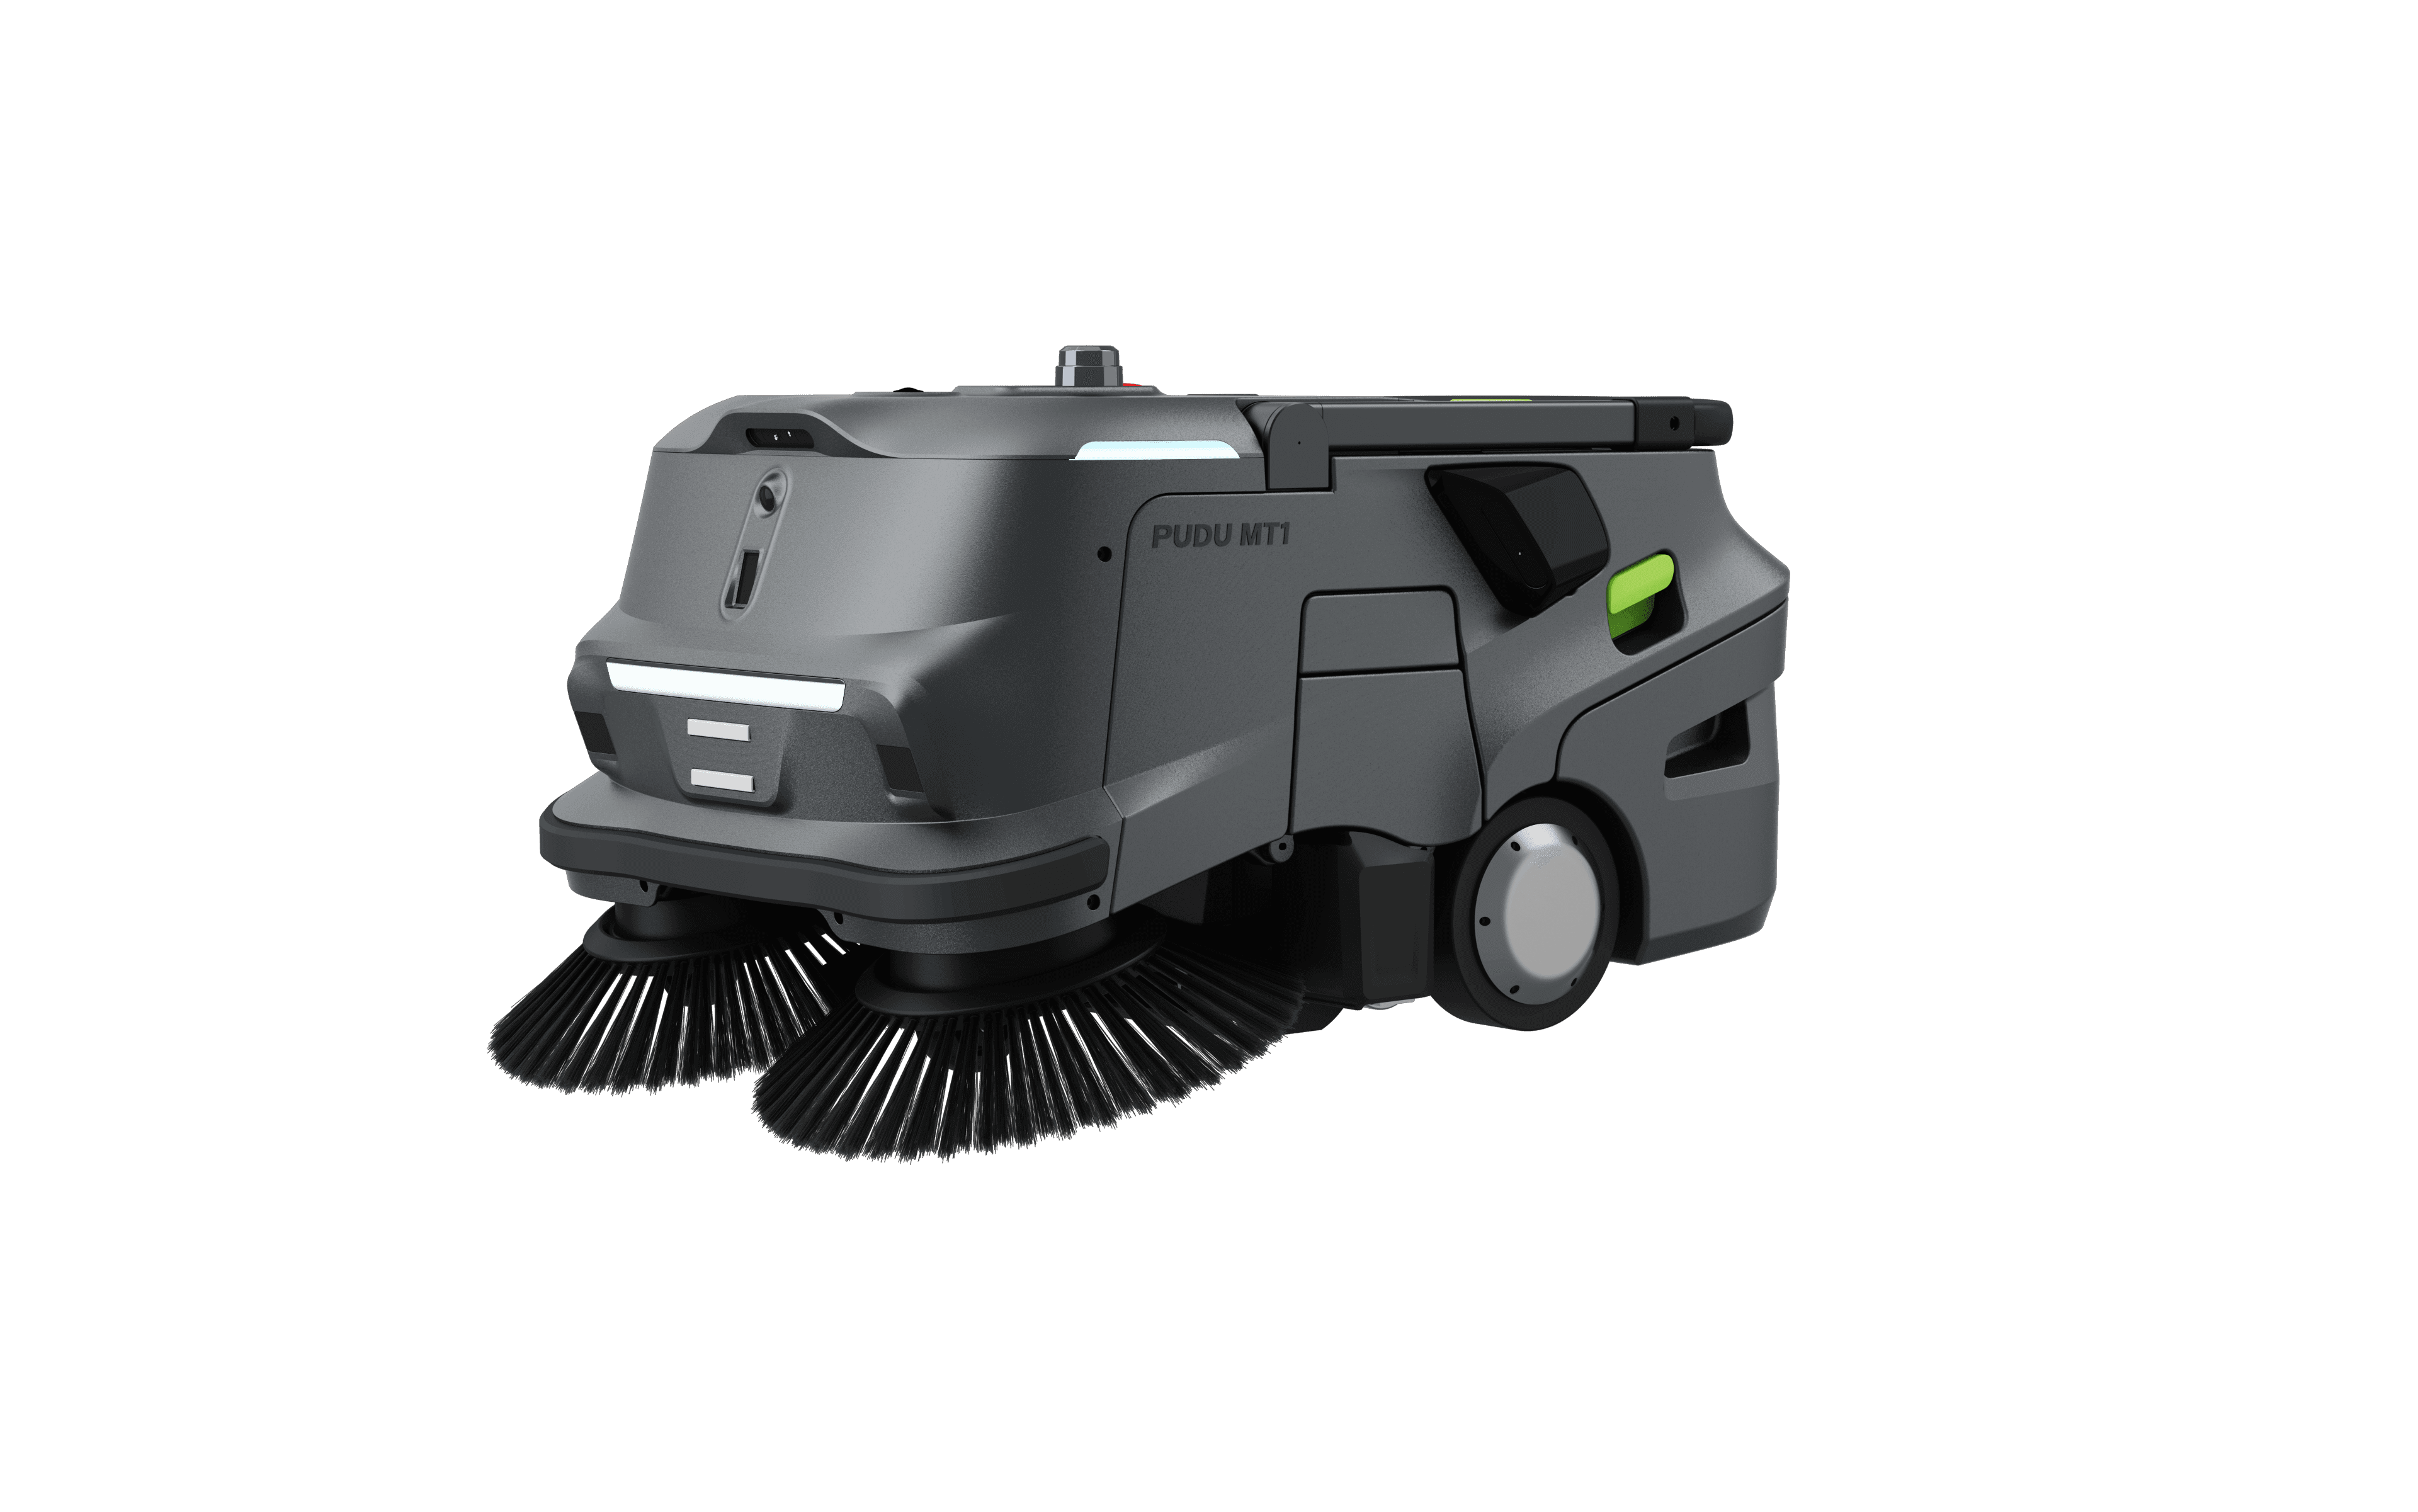
Most cleaning-robot dashboards lead with a coverage percentage. It is the wrong headline. The number that decides whether a machine pays for itself is interventions per robot-hour — the human minutes spent unblocking, emptying and restarting it per hour it actually cleans. On a PUDU MT1 working a distribution depot, letting that number drift from a planned 8 minutes to 25 costs A$1,392 a month, per robot. Coverage percentage will not tell you it happened.
The formula your ROI is actually computed from
Strip a cleaning-robot business case back and the labour saving is one subtraction: the hours a person would have spent cleaning, minus the hours a person still spends attending the robot. That is literally how our own engine computes it — manual hours in, supervision hours out, the remainder valued at your loaded wage rate.
Look at what is not in that line. Coverage percentage isn't. Neither is uptime, nor total distance travelled, nor any of the other numbers that make a nice dial. Those measure whether the robot is busy. Only one measured quantity in the whole model is under daily operational control and subtracts directly from the money, and it is the second term: attended time.
Our standing planning assumption is roughly 8 minutes of human attention per robot cleaning hour — loading, bin emptying, checks, clearing whatever the machine flagged. It is a planning rule of thumb, not a promise; the Fleet & ROI Planner costs whatever daily supervision figure you give it. The point of a fleet dashboard is to tell you which figure is true on your sites this month.
What drift costs, worked through
Illustrative worked example. The depot profile and the intervention rates below are representative, not measured from a named customer. Machine specs and the throughput basis come from our catalogue; the labour arithmetic is shown so you can re-run it on your own numbers.
Take a contract cleaner running one MT1 in each of six ambient parcel depots — large open sealed-concrete floors, dry debris, cardboard dust and grit tracked in off the dock. Dry soil on hard floor is dry-sweeper territory, which is exactly what the MT1 is: sweep only, no water, no recovery tank.
Per depot: 5,500 m² of hard floor, of which about 90% (4,950 m²) is genuinely robot-reachable — the rest is under racking and in corners a machine can't turn into. At a planning throughput of 918 m²/h (PUDU's rated 1,800 m²/h cover mode, taken down by our uniform 0.6 real-world derate and 0.85 within-window duty factor) one MT1 clears that in about 5.4 hours — inside a six-hour night window, and inside the MT1's six-hour runtime, so no mid-pass recharge. Six nights a week is 26 nights a month, and we cost attended time at A$35/hour fully loaded.
5.4 robot cleaning hours × 26 nights × A$35/h fully loaded. At the planned 8 min/robot-hour a depot spends 18.7 attended hours a month; at 25 min/robot-hour it spends 58.5. The gap is (25 − 8) × 5.4 × 26 ÷ 60 = 39.8 attended hours, or A$1,392 a month per robot — pure leakage, and it never shows up in a coverage figure.
Across six depots that drift is A$8,354 a month, or roughly A$100,250 a year. Per robot it is A$16,708 a year against an indicative MT1 purchase price of A$25,992 ex-GST — you are burning about 64% of a new machine's price every year, on minutes nobody is counting.
Where the minutes actually go
The reason a reason-code log matters more than a coverage dial is that the five causes below have five different fixes, and only two of them are the robot's fault.
- Blocked path — pallets, cages, shrink-wrap38%
- Dust bin empty + filter shake (35 L bin)22%
- Re-map after a layout change18%
- Manual restart after lost localisation13%
- App / firmware admin9%
Illustrative shape of an exception log. The two site-discipline slices — blocked path and re-mapping after a layout change, 56% of the minutes between them — are site problems, not machine problems. Emptying the bin (22%) is routine servicing. Only the restarts and the admin (22%) sit with the robot. That split is the whole argument for reason codes over a single red dot.
Nearly 40% of that time is a dock-discipline issue: pallets parked in the robot's lane at 9pm. You fix that with a marked-out exclusion zone and a conversation with the evening shift, not with a better robot. But you can only have that conversation if the dashboard tells you why the machine stopped — and stop counts without reasons cannot.
The bin slice is different again. Emptying a 35 L hopper isn't a fault at all — it's scheduled servicing, and the only useful question a dashboard can answer about it is whether it's landing on a predictable cadence or being triggered early by unusually dirty runs. Sorting a month of interruptions into those three buckets — site, servicing, machine — is what turns one number nobody acts on into three conversations with three different people.
The exception flow that keeps the number down
Australian commercial cleaning runs on high turnover and unsociable hours. The supervisor who learned that Depot 3's robot always snags on the same corner may well not be there next year. A fleet dashboard is the only institutional memory you get — but only if the loop actually closes.
- Robot stopsLogs a reason code and holds position
- Dashboard raises itSite, robot, zone, reason — within minutes
- A named person owns itThe on-site responder, not the account manager
- Fix the causeMove the pallet; re-map the zone
- Verify next runSame zone failing twice is a site problem
What to demand before you sign
Software rarely appears on a cleaning-robot quote, and it is almost never compared across vendors on anything but screenshots. Ask all three brands the same six questions and compare the answers, not the interfaces.
| What you need | Why it changes the money | The question to ask |
|---|---|---|
| Autonomous run-hours per robot, per night | This is the first term of the saving. Without it you're estimating your own ROI | "Can I export nightly run-hours per robot as CSV, not a screenshot?" |
| Interventions with reason codes | Every minute above 8 per robot-hour subtracts from the saving — and the reason tells you who fixes it | "Is every stop logged with a cause, or just counted?" |
| Route completion vs the mapped plan | A robot that ran 5.4 hours but skipped a third of the zone hasn't displaced 5.4 hours of work | "Is completion measured against the map, or self-reported?" |
| One roll-up across every site | Six depots on six logins means nobody reviews any of them | "One account, all sites, one export?" |
| Runtime-per-charge trend | The MT1 plan assumes a 6-hour runtime. A pack quietly drifting to 4.5 h pushes the clean past the window | "Do you trend runtime per charge, and alert on decline?" |
| Documented API and data ownership | Your ROI model lives in your finance system, not their dashboard | "Is there an API, and who owns the data if we leave?" |
Vendors differ widely here, and integration platforms exist across the major brands — but what your account actually gets is a distributor question. Get the answer in writing before the machine lands, because retrofitting reporting onto a deployed fleet is how sites end up managing a robot fleet from an ad-hoc group chat and a spreadsheet.
The machine still has to fit
None of this rescues the wrong machine. The MT1 suits this scenario because the soil is dry and the floor is large, open and hard — its published strengths. Worth noting on ingress protection: our catalogue records the MT1 as IPX3, a water-splash rating with no dust digit published, while the PUDU MT1 Max carries IP54 and is the unit we position for genuinely dusty warehouse and logistics floors. If your depot runs dustier than average, that difference is worth more than any dashboard feature.
- Size a right-fit fleet on your own floor area, window and wage rate with the Fleet & ROI Planner — including the daily supervision figure this article is about.
- Or tell us about your sites and we'll send a vendor-neutral shortlist with the reporting questions above ready to put to each vendor.
Frequently asked questions
- What should a cleaning robot fleet dashboard actually measure?
- Interventions per robot-hour — the human minutes spent unblocking, emptying and restarting the machine per hour it actually cleans. WhichBot's standing planning assumption is about 8 minutes per robot cleaning hour. On a PUDU MT1 running 5.4 hours a night, six nights a week, letting that drift to 25 minutes per robot-hour adds 39.8 attended hours a month — about A$1,392 per robot at A$35/hour fully loaded.
- Why isn't coverage percentage the right headline metric?
- Because the labour saving in a robot ROI model is manual cleaning hours minus human supervision hours — coverage percentage appears nowhere in that subtraction. A robot can report 99% coverage and still wreck its own payback if someone spent 40 minutes an hour walking over to restart it. Track coverage as a quality check; track intervention minutes as the money.
- What should I ask a vendor about their fleet management software?
- Six questions. Can I export per-robot autonomous run-hours per night as data, not a screenshot? Is every stop logged with a reason code? Is route completion measured against the mapped plan rather than self-reported? Is there one roll-up across every site? Do you trend runtime per charge and alert on decline? Is there a documented API, and who owns the data if we leave? If the answer to any of the first three is no, you cannot audit your own ROI.
- How much floor can one PUDU MT1 cover in a night?
- On WhichBot's uniform planning basis — manufacturer-rated 1,800 m²/h, derated 0.6 for real-world output and 0.85 for within-window duty — the MT1 plans at about 918 m²/h. In a six-hour night window that is about 5,510 m² of capacity. Every brand in our catalogue is sized on that same spec×derate basis, with a tighter 0.45 derate where a maker publishes only a theoretical maximum, so the comparison stays fair.
- Is the PUDU MT1 the right machine for a dusty warehouse floor?
- The MT1 is a dry sweeper — no water, no recovery tank — so it is the right class for dry debris on large open hard floors, which is what a distribution depot has. On ingress protection our catalogue records it as IPX3, a water-splash rating with no dust digit published; the PUDU MT1 Max carries IP54 and is the unit we position for dustier warehouse and logistics floors. On a genuinely dusty site, confirm the rating with the vendor before you commit.
Machines in this analysis
Full spec sheet and indicative Australian pricing for each.
Related reading
- Case StudyThe Robot Can't Go in the Freezer: Sweeping a Cold-Chain DC to a 20-Month PaybackA composite case study: sizing a dry-sweeper fleet for a −25 °C cold-chain distribution centre — why the freezer cells stay manual, why the ambient dock is where the payback lives, and the temperature spec that decided the shortlist.
- Case StudyA 3PL Warehouse at Peak: 4 Sweepers, 18,000 m² a Night, 22-Month PaybackA composite case study: sizing a PUDU MT1 Max dry-sweeper fleet for a third-party logistics shed whose cleaning window collapses for 13 weeks every peak — and why the flex came from the window, not the fleet.
- Case StudyWhat We Learned Deploying Sweepers Across a 40,000 m² WarehouseA composite case study of a six-robot sweeper rollout in a distribution centre — the shortlist on a uniform basis, the payback math, and the operational habits that made it stick.
Put these numbers to work
See which robot fits your facility and what it would save you.
Run the Fleet & ROI Planner